The purpose of this article is to go into depth a bit on Tenable’s Log Correlation Engine (LCE) and how to utilize it with Security Center to be the focal point of monitoring events in your environment. I’m a big fan (and user) of the Tenable suite of products, and have written previously about the Nessus vulnerability scanner. Nessus is just one part of an overall software package called Security Center CV (Continuous View). This consists of the vulnerability scanner, a passive IDS called Nessus Network Monitor (NNM), a log aggregator called Log Correlation Engine (LCE), and a dashboard application to visualize and alert on all of the date from these applications called Security Center (SC).
However, Tenable doesn’t like referring to any of this as a Security Information and Event Management (SIEM) tool. I go back and forth with that. The LCE really fits the bill as a tool that collects logs (via syslog or LCE client), stores, and correlates data between the events. This to me is good enough to be called a SIEM. It doesn’t, however, display the data or alert on it natively. Further, when you tie together the log event data, the IDS data from NNM, and compliance/vulnerability data from Nessus, you truly have a better overall picture of your environment.
You Down With Tenable LCE?… Yeah!… You Know Me!
Firstly, this is not an article on how to setup/deploy LCE, Security Center, and the rest of the tools. There is a lot of great documentation on that from Tenable itself. That is a time intensive task which requires a decent amount of planning with multiple stakeholders in your environment. For our purposes, we are going to look at how to use it from a basic operational standpoint. We are going to assume the following:
- All tools are operational and connected to each other as required
- All devices in the environment are sending log traffic via syslog or LCE client
- The proper roles and credentials are available to be able to access all required sections in Security Center
- The appropriate administrative system configurations for your environment are properly in place.
Looking at the Big Picture
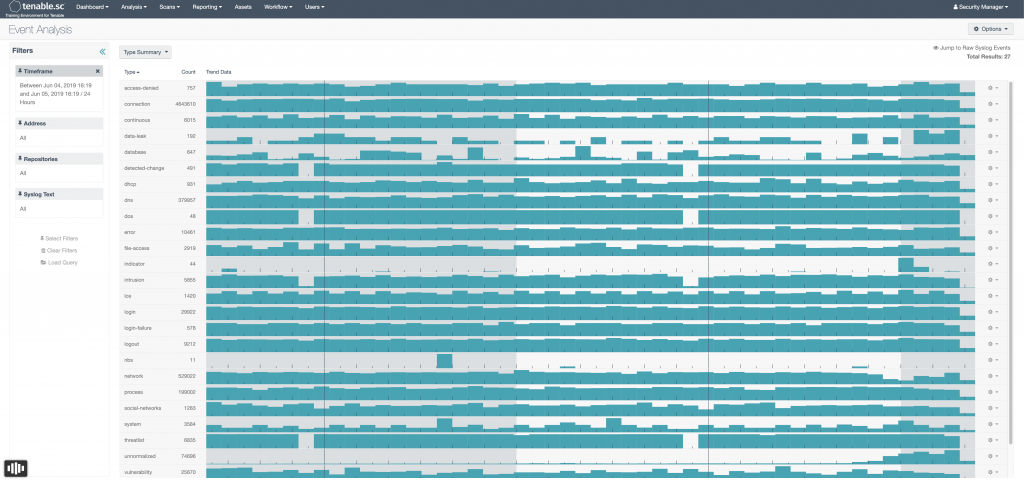
When logging into Security Center, to view the log event data, we want to go the Analysis tab on the top. This will bring us to the Type Summary view (which is the default view.) There are a few things here to get your bearings with off the bat.
- The main image is showing all events as grouped into Types over the past 24 hours. These types are pre-determined groups by Tenable. This is a good jumping off place when looking for certain types of events (or creating alerts)
- Each block in this view represents a 30 minutes window. You can drill down into each individual time frame by clicking on it
- On the left hand side you have a configurable filter, including: changing the time frame, altering the group of devices (repository), searching for specific words (syslog), and a whole bunch of other filters. I used filters a lot! You will want to play around with these as they can make finding things very easy, even things you didn’t know you were looking for.
- To look at different views, you can select the drop down menu (currently showing Type Summary.) There is a multitude of views which we are going to discuss below.
More Details?
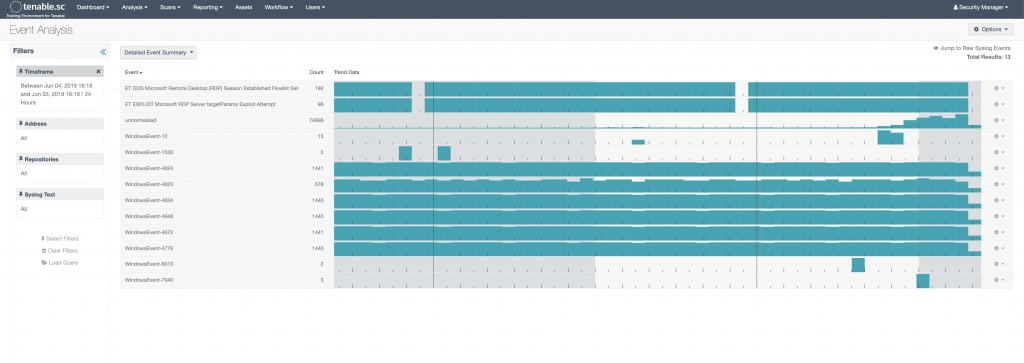
The Detailed Event Summary shows a more granular list of all of the log events. These are broken down by the names that the vendors use for their event names/IDs. Honestly, I’ve only really found this useful when looking for a particular Microsoft event ID. Even when doing that, there are better way to search.
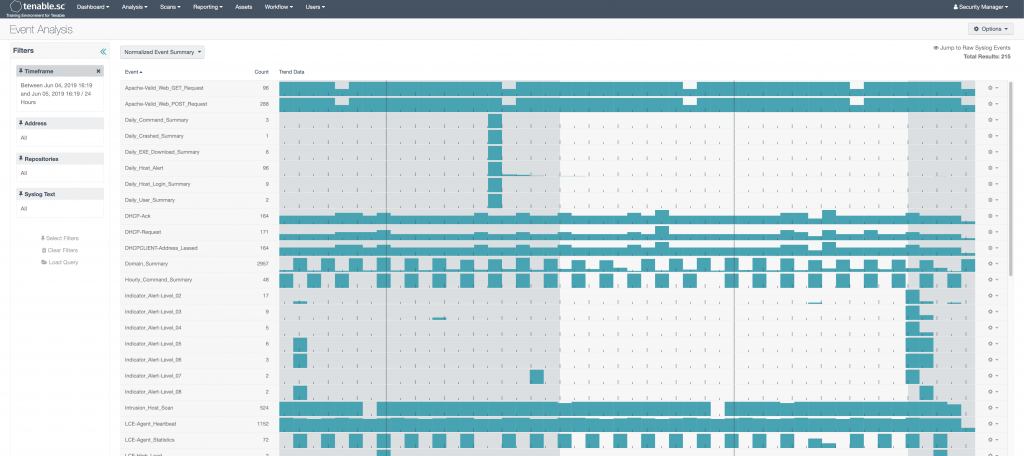
Normalized
This is probably my favorite event summary view in Security Center. LCE out of the box is able to ingest logs and determine in plain English what the log is without any guidance or configuration from the user. This works great for almost anything, and I think this is a true differentiator compared to other SIEM products. Anything that Tenable doesn’t know what it is, gets put in the Unnormalized event bucket. This is still perfectly fine- LCE will keep those log events if it is configured to do so. If you have disk space to do this, I would recommend it. You are still able to do syslog searches on Unnormalized log data, which means you can also still configure alerts on them as well.
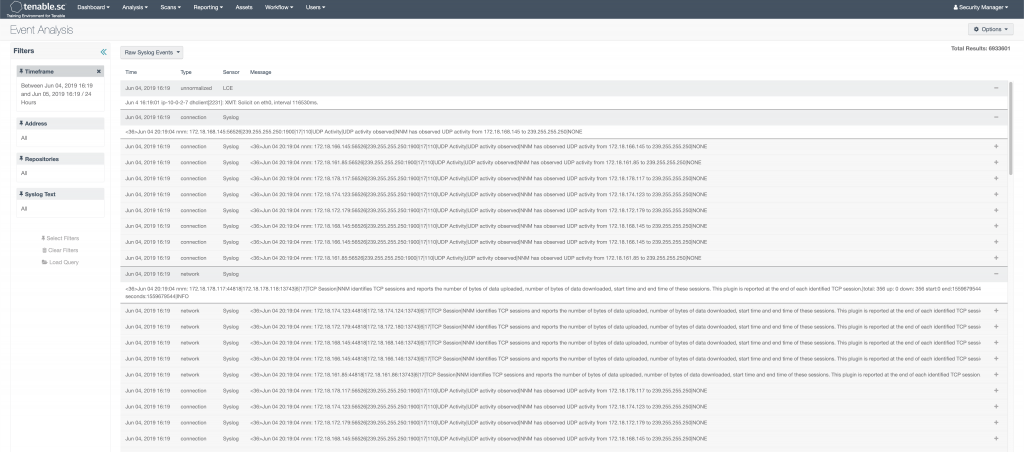
The Real Grit
At this point these views don’t actually allow you to see the real log event messages. Even if you keep clicking further and further, you will only end up with List of Events. That is nice, but only gives you a description, source/destination IP, timestamp, desitnation port, and event type. To see the actual logs, you need to select Raw Syslog Events from the drop down.
A few notes with this. First, we talked about the LCE collection data via syslog and their client. So, it really has more than just syslog events. I think they came up with the name a long time ago, and it just stuck. Second, when you click into this view, it will attempt to display ALL the logs in the given time period. So, if you have 30 million logs collected for the day, good luck swimming through those. The Raw Syslog Events view works much better, when either using filters in conjunction with it. Or, if you have drilled down on something all the way to the List of Events page, you can then select the Raw Syslog Events from the drop down menu and see the real log messages for the events you drilled down into.
I Know What YOU Did Last Summer
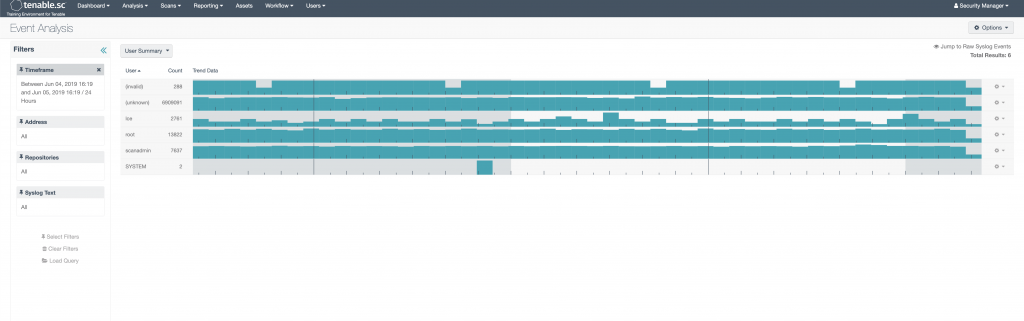
One other interesting view is the User Summary view. This will show all log events that are correlated with a particular user name. This can be somewhat helpful and interesting. Anything that can’t be correlated gets tagged as Unknown, which should make up the majority of your events. There are a few other views that might be useful, but I’m not going to discuss them here, if you want to see a further breakdown go here.
Those Are Pretty Pictures… Now What?
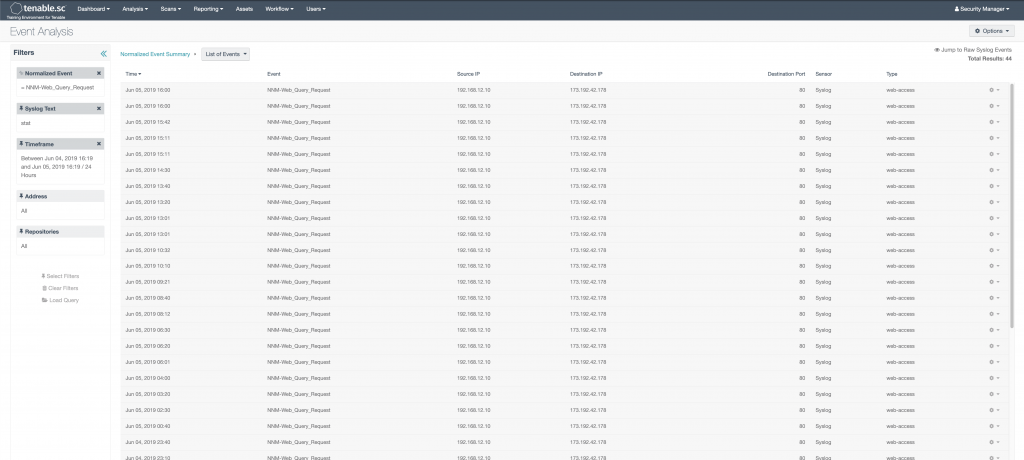
Let’s now walk through a bit of a use case on how to move through Security Center while looking for something specific. For instance, let’s say we were looking for a particular type of log that we knew had the word “stat” in it. We would first go to the Normalized Event Summary view and find the event we were looking for. In this case, we’ll say, we wanted to see web query requests that were picked up from the Tenable IDS (NNM). We would do three things:
- In the left hand side syslog filter, we would type in “stat” and click search. This would load a Normalized Event Summary page that all events have the word “stat”, somewhere in the text.
- We would then click on the event “NNM-Web_Query_Request”. This would take us to the “List of Events” page shown below.
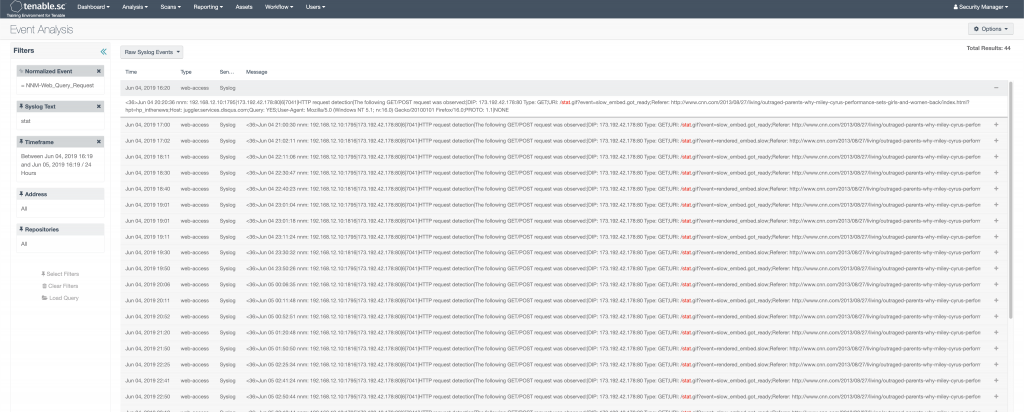
- From there, we would want to select Raw Syslog Events from the drop down menu to see the actual log message.
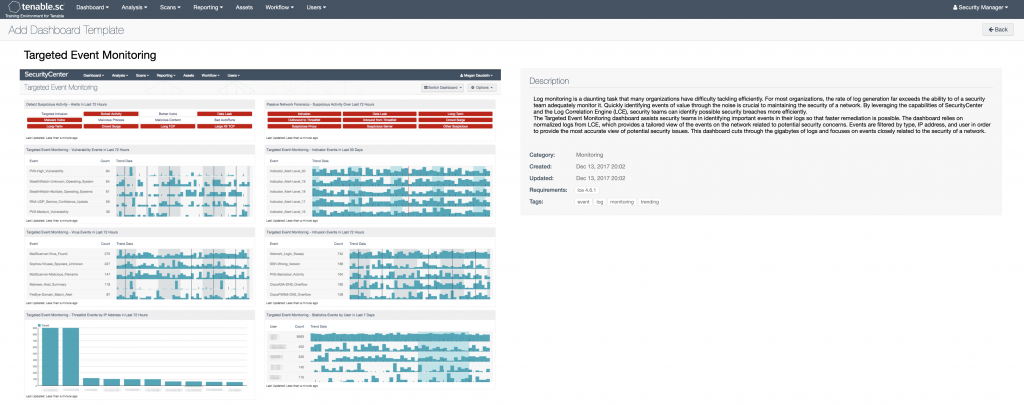
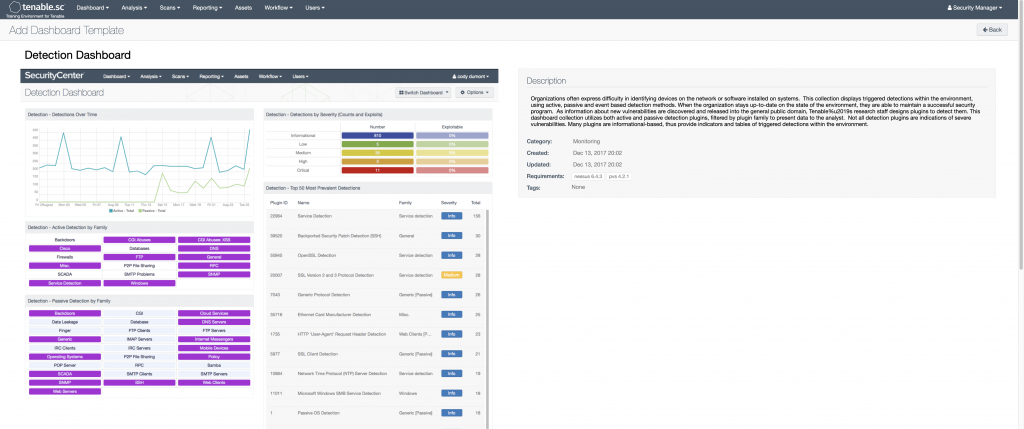
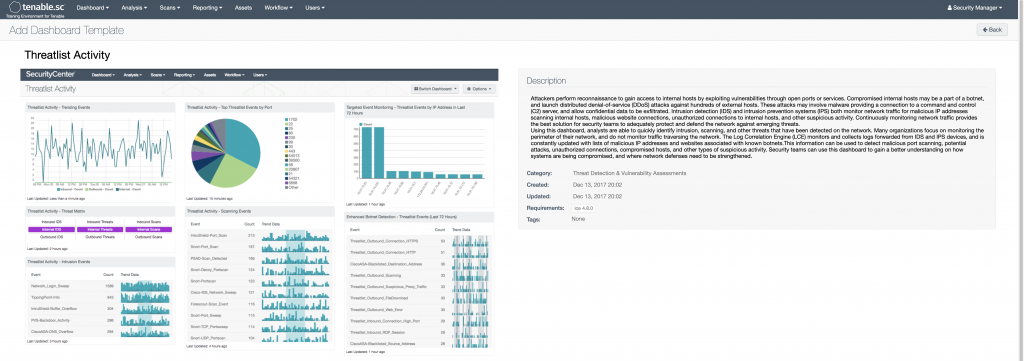
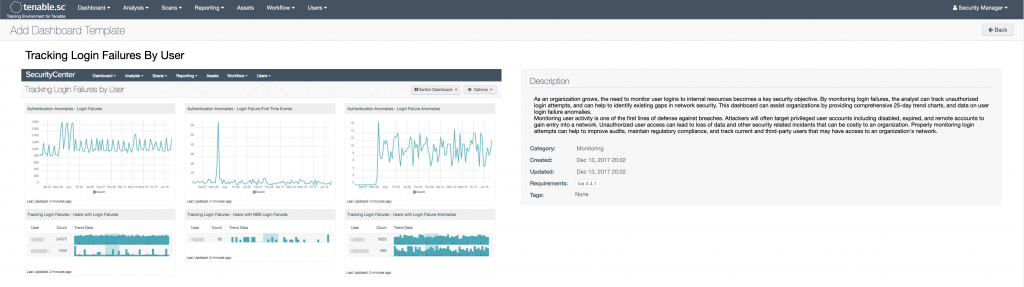
Did Someone Say Dashboards?
One of the other great things that Security Center does is tie together all the data from the various tools and present some very useful dashboards. I use their dashboards for various things like visualizing new users/devices in my environment, visualizing intrusion/vulnerability data, monitoring user login failures (especially helpful when monitoring off hours.) Below are a few that might be of some interest (there are literally hundreds.) To see a list of all of them with full descriptions, go here.
The Wrap Up
I hope this discussion might have peaked your interest into digging a bit more into the Tenable products and brought a little great appreciation as to how it can be a great tool for collecting and analyzing security information across your environment. If there is interest, I can do some further articles on how to configure alerting and advanced searches and queries.
Some solid references on the Tenable products are:
- https://community.tenable.com/s/
- https://www.tenable.com/plugins
- https://www.tenable.com/sc-dashboards
- https://docs.tenable.com/lce/Content/Components.htm
Find out more about J.B.C.’s CyberInSight™ blog here.